The fundamental relationship between service level and costs is often depicted as a steeply rising curve. There are two significant stages in the improvement of the service level. The first represents the point until a small increase in cost allows for a significant increase in the level of service. The second is the point beyond which significant cost increases are required to provide a little bit better service level (Exhibit 12-25). It makes a lot of sense to raise the level of service if there is little increase in costs. This is the principle of doing something that does not cost much to the seller or manufacturer, when it makes a tangible benefit to a customer.
There is little motivation in raising the level of service where a small increase in quality can significantly increase the cost of service. This may not apply except in the luxury segment, where the price of the product itself is so high that service costs are a relatively small part of the pricing. Meanwhile, in the segment of commodities and consumer goods, raising the level of service can increase service costs and at the same time increase the final price of the product so much that the added value from the service will be less significant than the price of the product.
Ex. 12‑25 Cost of service

Keywords: service level, costs
Source: (Christopher, 1992)
Logistics costs largely depend on the chosen responsiveness (Vickerman, 2012). For example, when seeking to make the customer service very responsive, and the delivery time of the goods as short as possible, then it is important to choose delivery by air. Global logistics organizations offer a service even up to 24 hours by airborne transport from any point in the world. So, if a customer needs a spare part very urgently and the value of this customer is very high, air transportation can also be used.
For example, shipping a microchip that is needed for a factory machine is likely to be shipped by air because if the one machine fails, it will incur costs that include downtime for the entire production line, including employee downtime. If the same chip was to be transported in a non-urgent order, it would be shipped in a container, along with other chips, and such shipping from Singapore to Europe or the US could take up to 20-40 days. So, there are two delivery alternatives, within a day or within a month. The cost of these shipping alternatives can vary by tens if not hundreds of times.
The higher the value of the product in relation to its weight or volume, the less significant its logistics costs are when decisions are made on the level of logistics service. This is because logistics costs are largely determined by the weight and volume of the shipment, as well as the speed at which the cargo needs to be delivered and, of course, the distance. Distance is important for transportation costs, but it cannot be said that transportation costs are directly proportional to distance. Transportation costs largely depend on the transport mode and the way the cargo is packaged (more in Chapter 14) and the structure of the transport service model and infrastructure network (more in Chapter 13). So, sometimes it is cheaper to bring the cargo over a longer distance than over a shorter one.
One of the most important criteria for logistics costs is the weight and size of the shipment and the need for speed. If there is no urgency, the logistics provider will wait until enough freight is being accumulated at the point of departure, then group the shipment with other shipments and carry them when the total amount of shipments is formed, which fully utilizes the capacity of the transport mean, such as trailer, container, train, or even a container ship.
Logistics providers aim for economies of scale and the lowest possible costs, but this is only feasible if there is no urgency. Between Asia and Europe and the USA, goods transportation by containers takes from a month to several months. However, in case of urgency, logistics providers have to use air transport, which is much more expensive. Items such as pharmaceuticals, electronic devices are relatively expensive compared to their size and weight. Meanwhile, furniture and building materials cost less if compared to their weight and size.
For a logistics operator, in terms of operations, there is no big difference between transporting 1,000 kilograms of furniture stacked on a pallet or 1,000 kilograms of smartphones. The expense of transporting phones may vary with security cost being higher compared to technical costs, but in general transportation costs are the same or very similar.
Ex. 12‑26 Product value and logistics costs
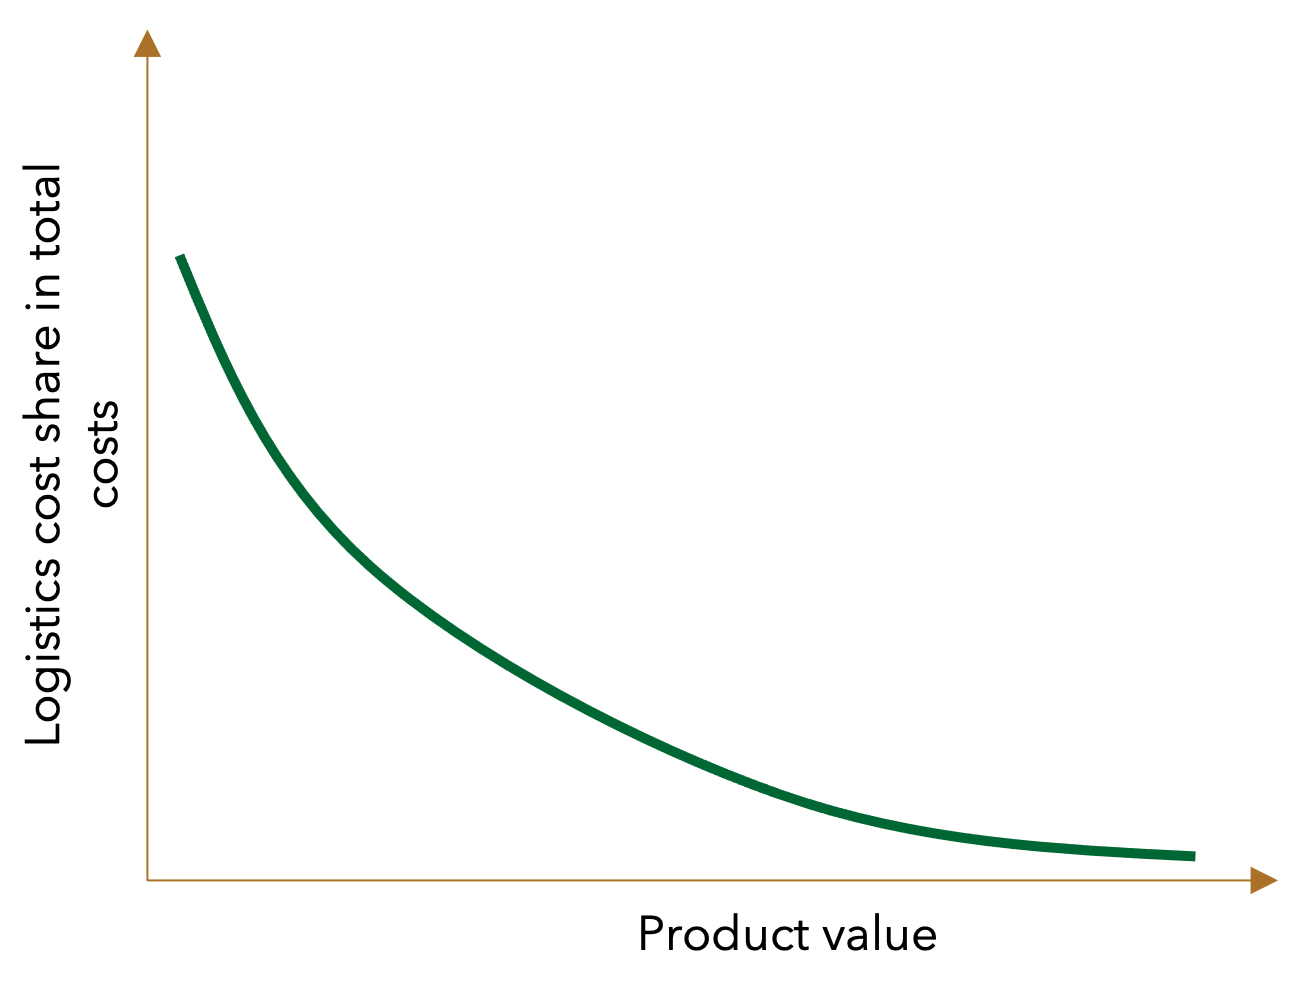
Keywords: product value, logistics costs
However, the product value of 1000 kilograms of furniture will likely be much less than 1000 kilograms of smartphones. The difference in value is likely to be tens of times. The more expensive the goods, the less painful the logistics costs are for the business (Button, 2022), because they compose smaller part in the final price of the product (Exhibit 12-26). For example, logistics costs of 3,000 US dollars for 1,000 kilograms of smart phones will probably add up to 1 percent of its final retail price. The phone takes up little space and weighs just a few hundred grams, and its retail price can reach 500 US dollars or even more. So, a 1,000 kilogram of shipment will contain 3,000 phones, and logistics costs for one phone will take just one dollar. However, if it is the same 3,000 US dollars is logistic costs for a 1,000 kilogram of furniture, this proportion will be significantly higher. Such a shipment of furniture will likely contain 100 pieces of furniture, for instance chairs, retail prices is about 50 US dollars each. So, logistics costs for each piece of furniture will be 30 dollars, and if it is to be compared to with the price of 50 US dollars per unit, the logistics costs add up 60 percent on top of product price. In other words, logistics will increase the price of furniture up to 80 US dollars and decrease competitiveness of the product.
Logistics costs include many different operations, each of which has a different cost. Every aspect of logistics function, such as transportation, warehousing, unloading, packing, order management, incurs a cost that collectively determines the final price of logistics services. Depending on the product, the size of the shipment, weight, volume, distance, the price structure of each logistics function may differ (Prentice & Prokop, 2016). Nevertheless, it is accepted to consider that the largest part of the costs falls on transportation and storage (Exhibit 12-27). However, transportation and storage costs compete with each other (Stroh, 2006), depending on the size of the shipment and the frequency of transportation (Exhibit 12-28). The same amount of goods can be delivered in small shipments often and vice versa, it can be delivered in one very large shipment. If an organization decides to avoid or reduce significantly inventory and storage, then it must transport often and in small shipments, so most of the logistics costs will be transportation.
Ex. 12‑27 Approximate structure of logistics costs

Keywords: transport costs, warehousing costs
Source: adopted from Armstrong and Associates, www.3plogistics.com
If an organization wants to reduce transportation costs and makes larger shipments, it means that the organization incurs more costs in storage, because after bringing a larger quantity, it is likely that the goods will need to be stored. Just-in-time logistics represents the situation where transportation costs are highest, and storage costs are lowest. Each organization determines in its business plan and strategy the most suitable size of shipments, transportation frequency and storage needs based on minimal inventory level. Each case is unique. For the manufacturer, it is relatively easy to plan the logistics and the balance between transportation and storage costs. The factory usually has monthly or quarterly production plans, so it is possible to predict how many components, or raw materials will be needed. Based on this, it is possible to calculate the optimal amount of stock in the warehouse, the optimal order size. Thus, in inbound logistics, logistics are planned based on production forecasts. Meanwhile, planning the outbound logistics, i.e., the distribution of manufactured products to retail outlets is already causing certain difficulties, as it is not known in which store how many goods will be purchased.
In retail, probability theory and various statistical analysis and forecasting methods are applied to define optimal order quantity. The probability of a certain level of sales is represented by bell-shaped curve, which reflects the law of normal distribution (Exhibit 12-29). The curve assumes that the demand for the product is normally distributed, i.e. it takes the classic shape of a bell. The distribution shown describes the average daily sales volumes for a specific product.
A different quantity of the same product may be sold each day. The highest probability, even 99.7 percent, is that items be sold in interval from A to G, but such a wide number of options is not suitable for inventory planning. The two main characteristic of the normal distribution are the average (x-) and the standard deviation (s), so, the probability of the occurrence of a certain value can easily be calculated.
Ex. 12‑28 Transportation and warehousing costs dependence on order size
![]()
Keywords: shipment size, transportation costs, warehousing costs
Source: (Bowersox et al., 1968)
The law of normal distribution says that there is a 68.3 percent probability that the demand will fluctuate between C and E, that is, it will be within one standard deviation with a plus or minus sign. The average demand for each day in this case is expressed as D. In approximately 95 percent of cases, the total demand would be equal to plus or minus two standard deviations, and in 99 percent of cases – three standard deviations from either side of the mean, i.e., plus or minus.
When calculating how much inventory is needed, the inventory manager is only concerned with situations where demand is higher than average. How much stock to hold is determined in the right side of the curve. The demand probability that reflects interval from F to G is very small, the same as when demand is between A and B. In this case, the inventory manager usually chooses an inventory level between D and E.
Ex. 12‑29 Probability of a sales level
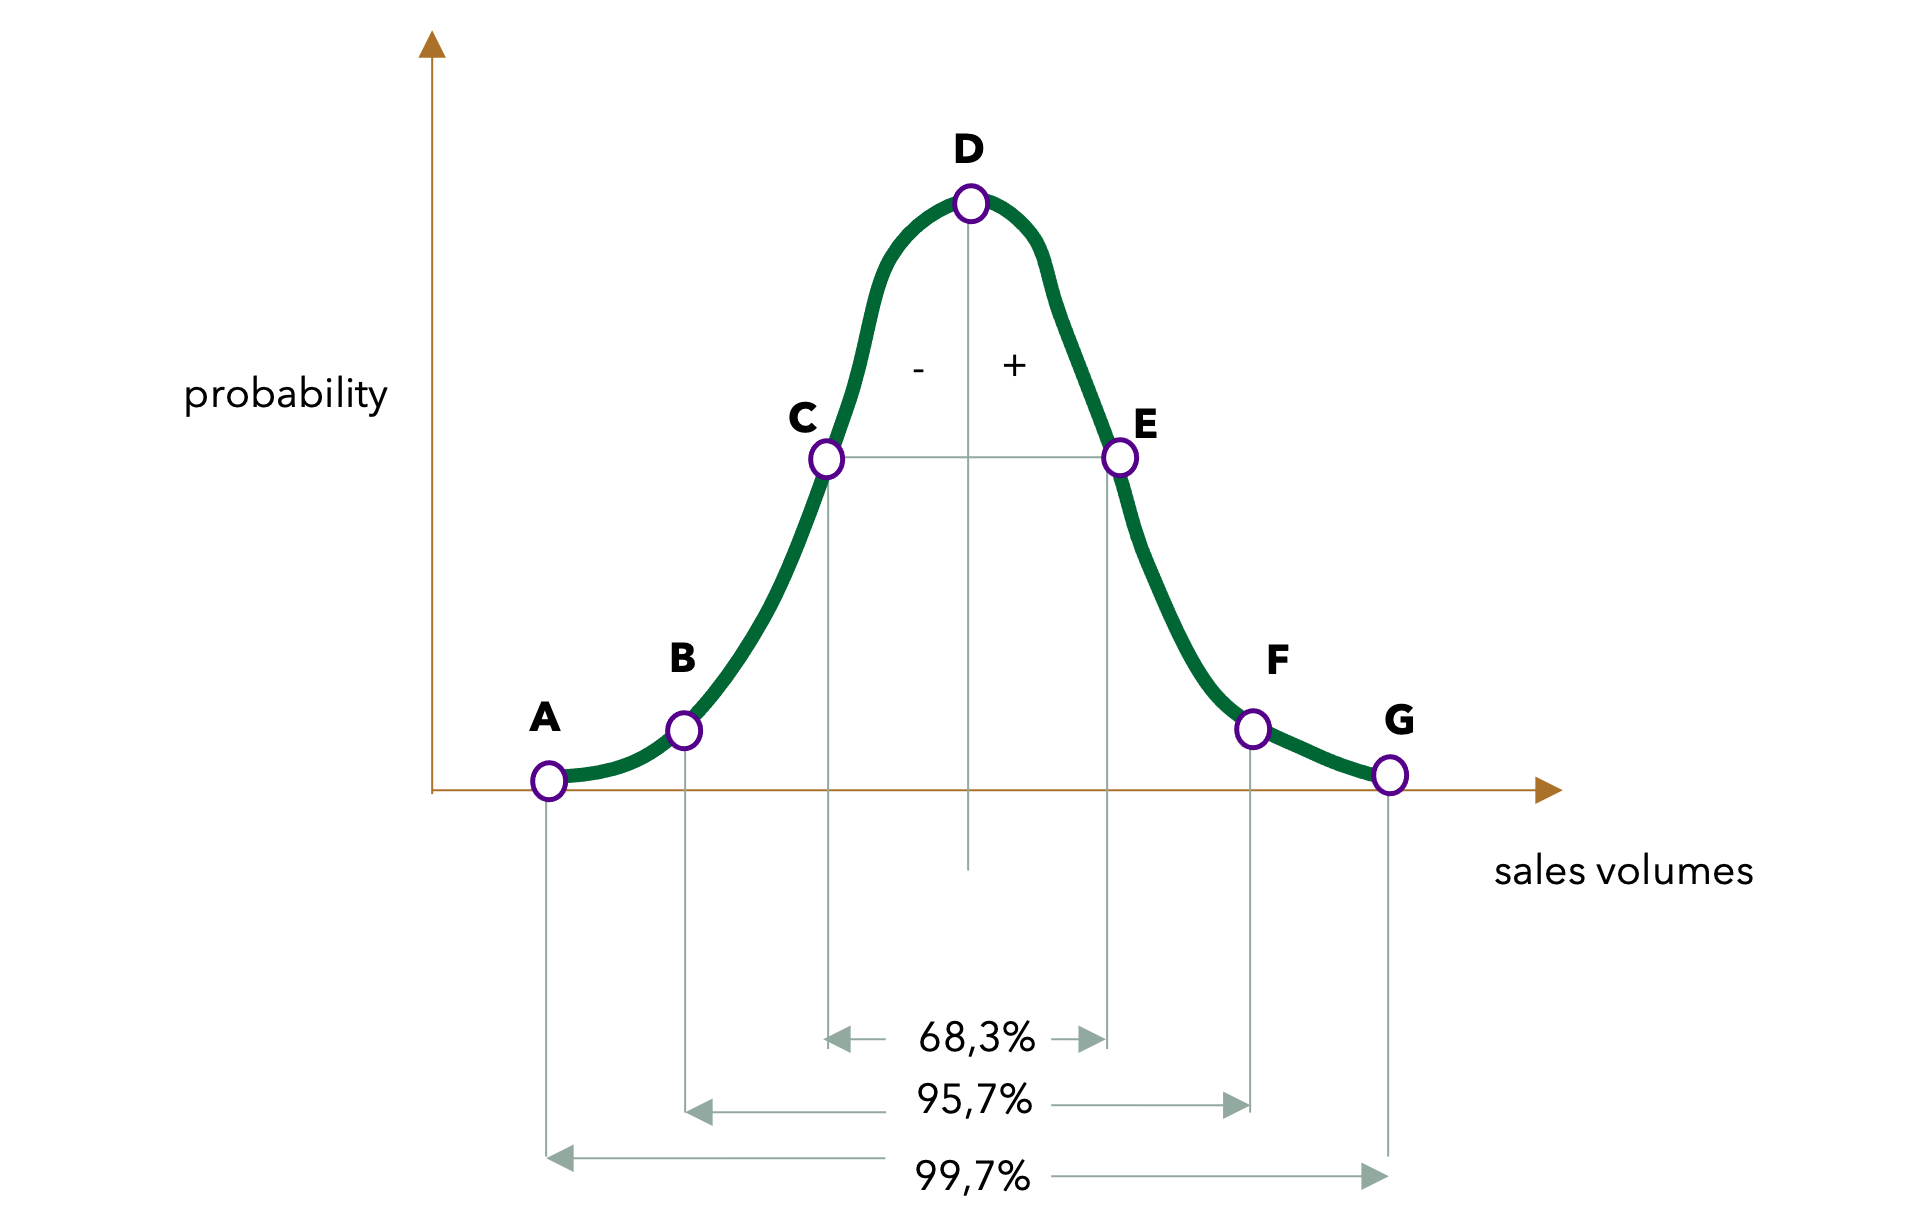
Keywords: probability, normal distribution
Source: (Christopher, 1992)
Ex. 12‑30 Pareto rule
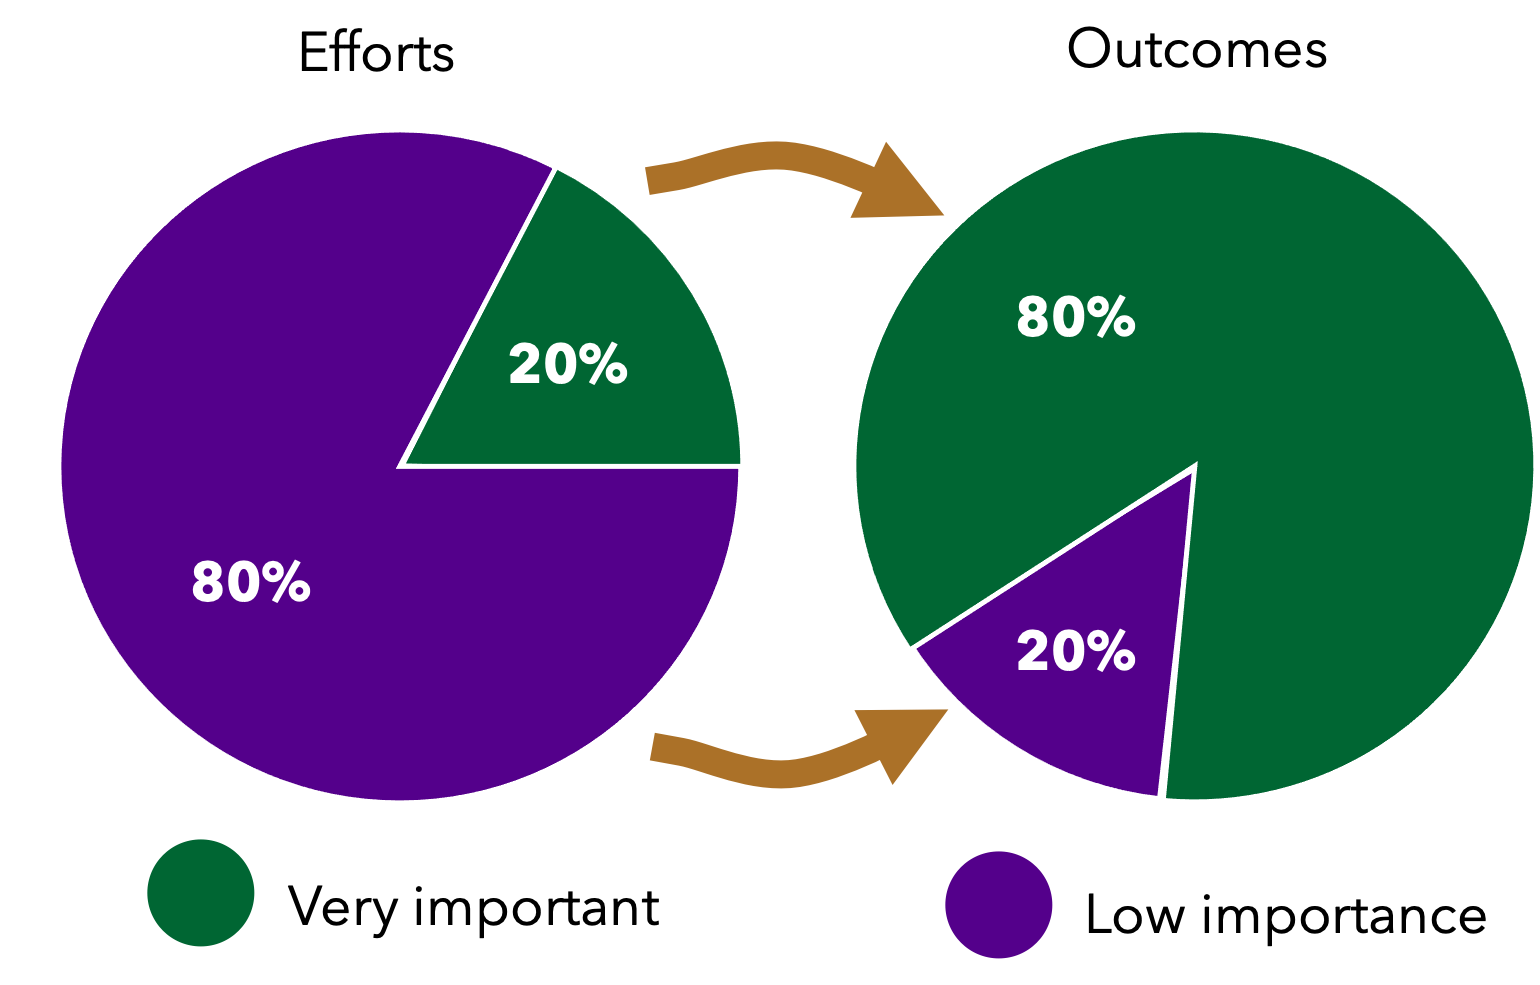
Keywords: efforts, outcomes
Source: adopted from Juran Institute Quality Improvement
There is no single answer to how much inventory should be held, because the answer depends on the costs of inventory holding and their relationship to the price of the product and to the characteristics of consumer needs in a particular product segment.
In the ultra-luxury segment, the inventory level can also be focused on the segment between F and G, although this will mean huge frozen funds and inventory handling and storage costs. Meanwhile, in the low-cost commodity goods segment, inventory levels between E and F are questionable.
Another important regularity that applies to logistics decisions is the Pareto rule (Exhibit 12-30). Any organization face a basic fact that there to be large differences in profitability between customers. Not only do different customers buy different quantities of different products, but the cost of serving these customers will usually vary greatly.
The 80/20 rule often applies as 80 percent of a business’s profits come from 20 percent of its customers. Although the proportion may not be exactly 80/20, but long-term observational practice suggests that the ratio will be similar. This is the so-called Pareto rule, named after the 19th century Italian economist by Juran (Juran, 2003). Thus, the customer service challenge is, first, to determine the true profitability of each customer, or product and then to develop service strategies that improve the profitability of those best customers and products (Karuppusami & Gandhinathan, 2006). It must be recognized that there are both costs and benefits to providing customer service, and the appropriate level and mix of service levels vary depending on the type of customer.
Pareto’s rule is applied when calculating inventory levels (Exhibit 12-31). The curve is traditionally divided into three categories: the top 20 percent of products and customers in terms of profitability are in category A; approximately 50 percent are labelled B; and the last 30 percent is a C category. The exact division of the categories is an approximation, as the shape of the curve can vary from business to business and market to market, but years of research show that approximate percentages of this curve hold true.
Ex. 12‑31 Pareto rule application for inventory level
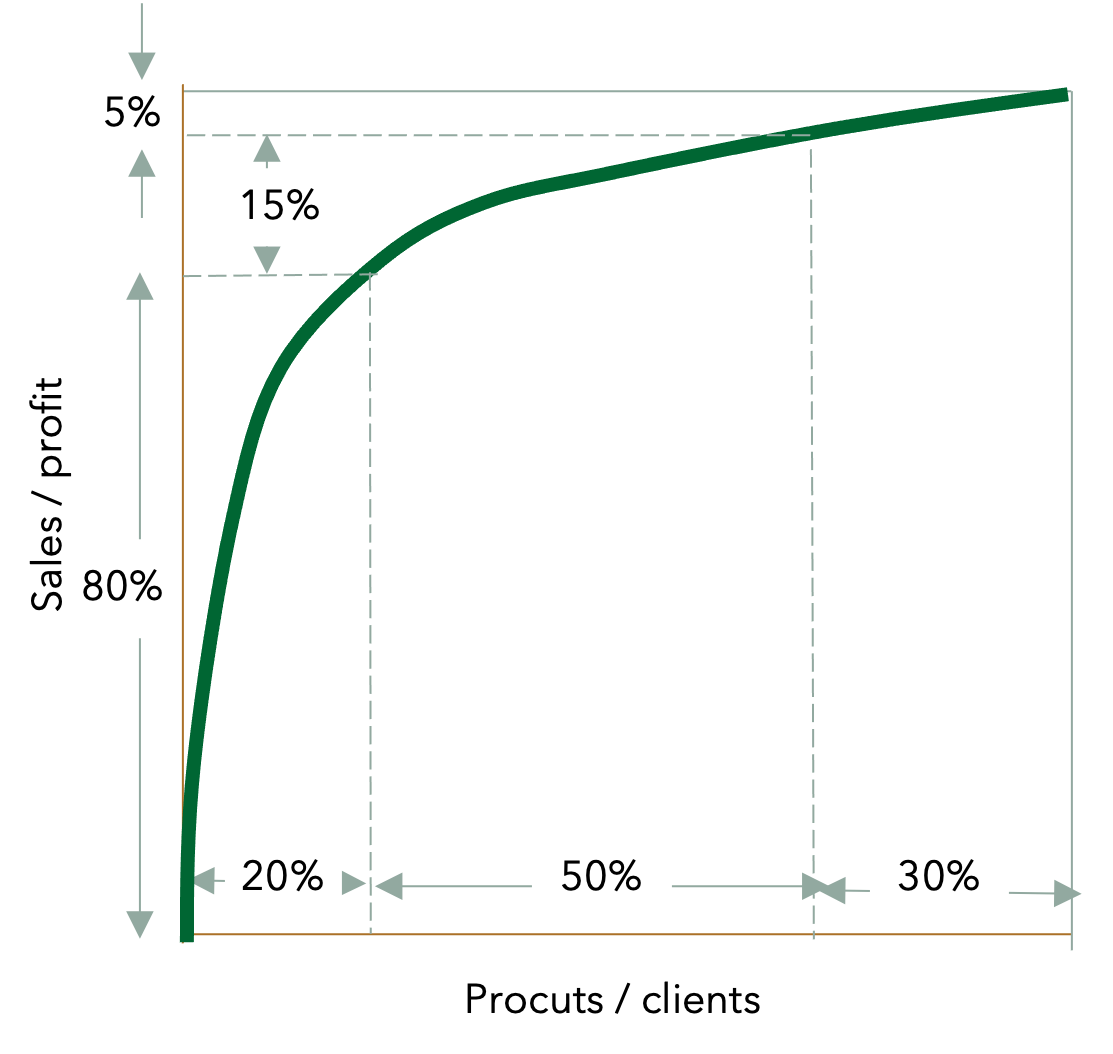
Keywords: product, clients, sales, profit
Source: (Christopher, 1992)
The usual objective is profit, not sales revenue or volume. The reason for this is that revenue and volume measures can mask large differences in costs. In the case of product profitability, it also important to be careful in determining the appropriate service-related costs, as these vary by product. Only in cases of expansion strategy some organizations focus on volumes instead of profit, but in the long run profit of each stock keeping unit matters.
One of the problems here is that conventional accounting methods do not help to identify these costs. What it important to do at this stage of the analysis is determine the profit contribution of each product i.e., of each individual SKU level. However, this may require a change in the management accounting system, which allows recording and assigning all organization costs as accurately as possible to each SKU.
The best way to manage a product’s service level is to consider both the profit contribution and the individual demand for the SKUs (Anderson, 2006). Both measures could be represented as a simple matrix (Exhibit 12-32). The matrix can be explained as follows.
Quadrant 1: Need to reduce costs. Since some products have a high sales volume, it shows that they are often in demand. However, their profit contribution is low per unit, so the product manufacturing and logistics costs should first be re-examined, to see if there are opportunities to increase profits through cost reduction.
Quadrant 2: This is the best segment because of high profit per unit and volumes of sales. It is important here to ensure high availability. It is important to offer the highest level of service for these items by keeping them as close to the customer as possible. Since there will be relatively few products in this segment, this strategy can be afforded, even if it leads to higher logistics costs.
Ex. 12‑32 Inventory level dependence on scope of product sales
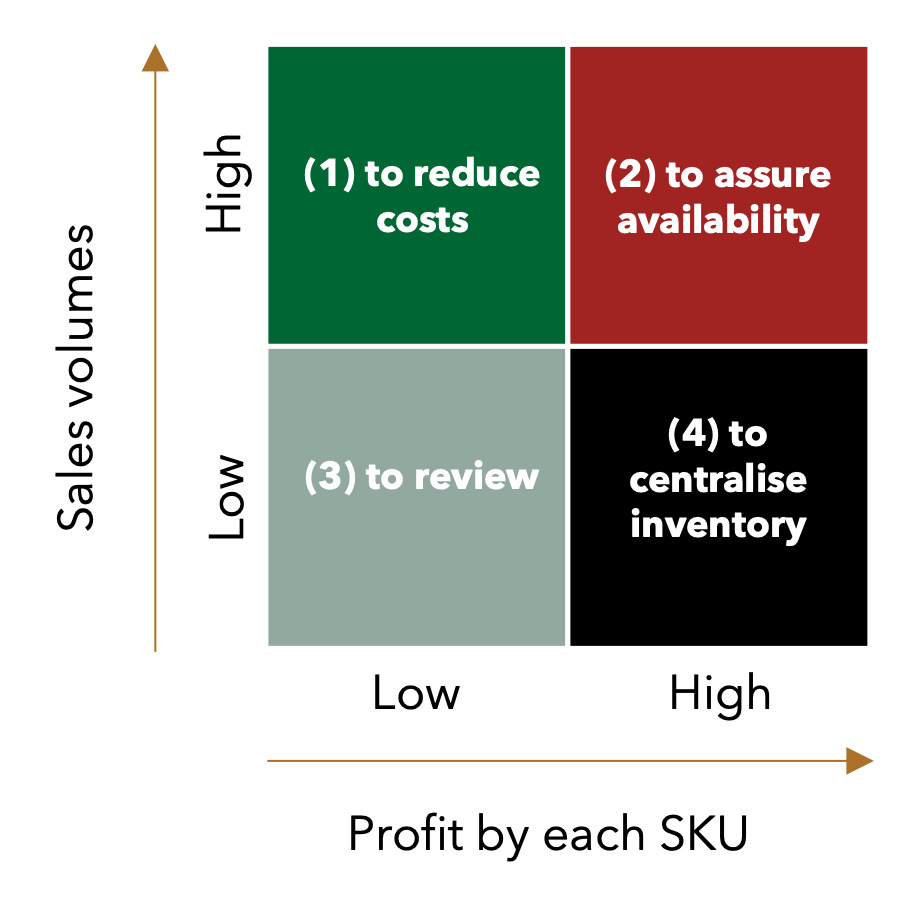
Keywords: inventory management, stock keeping unit, segmentation
Quadrant 3: Low sales value and low profit per unit products need a review. Products in this category should be regularly evaluated with a view to removing them from the range in the long term. These products are worth keeping only if they play a strategic role in the organization’s product portfolio and having them keeps customers loyal and leads them to buy products from other segments. If the product is not strategic, then the most important thing is to identify the products in this segment as soon as possible and abandon them as soon as possible, replacing them with other products. Often, abandoning products frees up production resources and warehouses, which makes it possible to produce more profitable products or those with higher sales.
Quadrant 4: Since some products are very profitable per unit, but sold in small quantities, it is very important not to accumulate a lot of them in many places, but to keep them concentrated in one place. Centralized inventory is the best strategy here. Important is to be able to quickly deliver them to the consumer when needed. A quick response logistics system is very important here.
Thus, when planning logistics service, the greatest attention must be paid to those products and those clients which generate the greatest profit (Christopher & Peck, 2003). However, to know which customers and which products are the most profitable, the traditional accounting system, which serves accountability to taxes and shareholders, needs to be supplemented with a management accounting system, where the accounting unit is the product and the customer.
Share or comment this information on your social media:
Fundamentals of global business
First edition
For citation:
Jarzemskis A. (2025). Fundamentals of global business, Litibero publishing, 496 p.

Full scope of the book is available in various formats
About author
The author has been teaching at several universities since 2005. 40+ scientific publications, 10+ international research projects. More about author.